Traumatic brain injury (TBI) affects millions of American families each year, yet many people remain unaware of the staggering scope of this public health crisis. Understanding current brain injury statistics can help families recognize warning signs, seek appropriate care, and protect their legal rights when injuries result from negligence. If you or a loved one has suffered a brain injury due to someone else’s actions, consulting with an experienced brain injury attorney can be crucial for securing the compensation needed for recovery.
The Alarming Scale of Traumatic Brain Injury Statistics in America
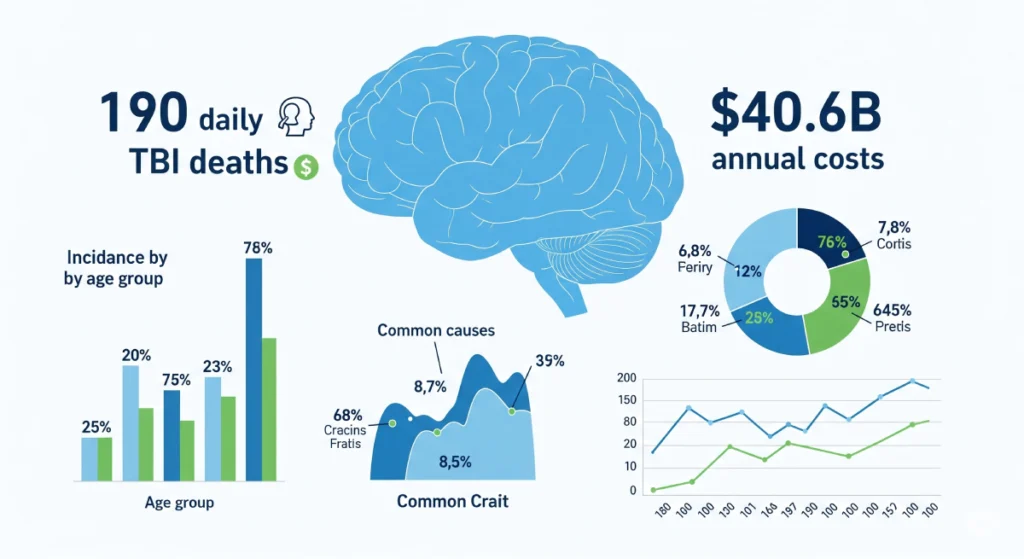
Daily TBI Facts: A Crisis in Numbers
The most recent TBI facts from the Centers for Disease Control and Prevention reveal the devastating daily toll of brain injuries across the United States:
- 190 TBI-related deaths occur every day – that’s approximately 69,473 deaths annually as of 2021
- Over 586 TBI-related hospitalizations happen daily – representing approximately 214,110 hospitalizations in 2020
- These figures represent only cases requiring hospitalization and don’t include the thousands of brain injuries treated in emergency departments, urgent care centers, or those that go untreated entirely
The Hidden Epidemic: Underreported Brain Injury Data
Current traumatic brain injury data suggests we’re only seeing the tip of the iceberg. Research indicates that:
- 75-80% of all TBIs are classified as “mild,” including most concussions
- 28% of people with TBI never seek medical treatment, according to New Zealand prospective studies
- 64% of TBI cases are identified through hospital visits, while only 8% are seen by family doctors, leaving a significant portion undiagnosed
Brain Injury Statistics by Demographics: Who Is Most at Risk?
Age-Related Vulnerabilities
Brain injury statistics reveal distinct age-related patterns that every family should understand:
Older Adults (75+ years):
- Account for 32% of all TBI-related hospitalizations
- Represent 28% of all TBI-related deaths
- Face the highest rates of both hospitalization (320.8 per 100,000) and death from TBI
- Often experience missed or delayed diagnosis due to symptoms overlapping with dementia
Children and Adolescents:
- Face unique risks during critical brain development periods
- Youth tackle football athletes experience a median of 378 head impacts per season
- Childhood TBIs can significantly impact ongoing brain development
Gender and Demographic Disparities
Critical TBI facts about demographic differences include:
- Men are three times more likely to die from TBI than women (28.3 per 100,000 rate)
- American Indian/Alaska Native populations consistently show the highest age-adjusted TBI-related death rates
- Motor vehicle crashes account for the highest rate of TBI-related deaths in tribal communities
The Economic Devastation: TBI Statistics and Costs Families Need to Know
Individual Financial Impact
The financial burden of brain injuries extends far beyond initial medical bills:
Immediate Costs:
- Emergency room treatment: Over $6,620 on average for a single visit
- Lost wages: Average of $1,600 for approximately 11 days of missed work initially
- Inpatient rehabilitation: $1,600 per day, averaging $46,000 total
Lifetime Financial Impact:
- Mild to severe TBI lifetime costs: Range from $85,000 to $3 million per patient
- Severe TBI cases: $600,000 to $1.8 million in medical costs alone
- Lost productivity: Can be ten-fold higher than direct medical costs
Societal Economic Burden
Traumatic brain injury data reveals the broader economic impact:
- Annual healthcare costs: $40.6 billion for nonfatal TBIs nationwide in 2016
- Total annual U.S. cost: Estimated at $76.5 billion as of 2010
- Worldwide economic burden: Approximately $400 billion annually
Employment and Long-Term Outcome Statistics
The Employment Crisis
Perhaps most concerning are the brain injury statistics related to long-term employment outcomes:
- 60% unemployment rate among TBI survivors two years post-injury (compared to 5.1% national average)
- Nearly 8% of TBI survivors become newly unemployed each year for at least three years post-injury
- 53% of homeless individuals are estimated to have experienced a traumatic brain injury
Five-Year Recovery Outcomes
Data from the TBI Model Systems National Database reveals sobering TBI facts about long-term recovery:
- 22% of TBI patients die within five years
- 30% experience worsening condition
- 22% remain unchanged
- Only 26% show improvement
These statistics underscore why early, appropriate intervention and legal advocacy can be crucial for maximizing recovery potential.
Leading Causes: How Brain Injuries Occur
Understanding how brain injuries happen can help families take preventive measures and recognize when legal action may be warranted:
Primary Causes by Severity
Mild TBI:
- Falls (particularly in older adults)
- Sports-related injuries
- Motor vehicle accidents
Moderate to Severe TBI:
- Falls: Leading cause of hospitalizations
- Motor vehicle crashes: Major contributor to fatalities
- Firearm-related injuries: Most common cause of TBI-related deaths nationwide
- Assaults: Significant factor in severe injuries
Military and Veteran Populations
Traumatic brain injury data for service members reveals concerning trends:
- Over 450,000 U.S. service members diagnosed with TBI between 2000 and 2021
- 80% of military TBIs occurred in non-deployed settings
- 82.3% of military TBIs are classified as mild (including concussions)
- 320,000 military personnel affected by brain injury since 2001, according to Wounded Warrior Project estimates
The Global Burden: Years of Life Lost
International brain injury statistics provide sobering context:
- 8.1 million years lived with disability globally due to TBI
- Global disability rate: 111 per 100,000 population
- 1.3 million years of potential life lost in 16 European countries during 2013 alone
- TBI accounts for 41% of overall years of potential life lost among all injuries in studied European countries
Special Populations at Risk
Vulnerable Communities
TBI facts reveal disproportionate impacts on specific populations:
Criminal Justice System:
- Nearly 50% of individuals in correctional facilities have a history of traumatic brain injury
Sports Participation:
- Youth tackle football players face significant cumulative head impact exposure
- Professional and college athletes increasingly recognized as at-risk populations
Domestic Violence Survivors:
- Intimate partner violence represents a significant but underrecognized cause of TBI
- Often involves repeated, undocumented head injuries
Prevention and Early Recognition: What Families Can Do
Warning Signs Requiring Immediate Medical Attention
Based on current traumatic brain injury data, families should watch for:
Physical symptoms:
- Persistent headaches
- Nausea and vomiting
- Loss of consciousness (any duration)
- Confusion or disorientation
Cognitive changes:
- Memory problems
- Difficulty concentrating
- Changes in sleep patterns
- Personality changes
Prevention Strategies
Brain injury statistics support these prevention measures:
- Consistent seatbelt use in all motor vehicles
- Proper helmet use during sports and recreational activities
- Fall prevention measures especially for older adults
- Home safety modifications to reduce slip and fall risks
Legal Rights and When to Seek Help
When brain injuries result from someone else’s negligence, understanding your rights becomes crucial. TBI facts about legal outcomes show:
- Medical costs, lost wages, and long-term care needs can reach millions of dollars
- Early legal intervention can help secure resources for optimal recovery
- Documentation of symptoms and treatment is essential for any potential legal action
For families dealing with the aftermath of accidents, understanding brain injury law can provide valuable insight into available legal options and compensation.
Recognizing Potential Legal Cases
Brain injury cases may have legal merit when they result from:
- Motor vehicle accidents caused by negligent drivers
- Workplace accidents due to safety violations
- Medical malpractice or misdiagnosis
- Defective products that fail to provide adequate protection
- Premises liability situations (slip and falls, inadequate security)
The Importance of Comprehensive Care
Traumatic brain injury data emphasizes that optimal outcomes require:
- Immediate, appropriate medical intervention
- Comprehensive rehabilitation services
- Long-term follow-up care
- Family support and education
- Legal advocacy when injuries result from negligence
Looking Forward: The Need for Better Data and Support
Current brain injury statistics likely underestimate the true scope of this public health crisis. The CDC’s developing National Concussion Surveillance System aims to:
- More accurately determine how many Americans sustain concussions annually
- Better understand causes and risk factors
- Improve prevention and treatment strategies
- Support more effective policy development
Take Action: Protecting Your Family
Understanding these TBI facts and brain injury statistics empowers families to:
- Recognize warning signs early and seek appropriate medical care
- Implement prevention strategies to reduce injury risk
- Understand the potential long-term impacts of brain injuries
- Know when to seek legal counsel if injuries result from negligence
- Advocate for comprehensive care and support services
Conclusion: Knowledge Saves Lives and Protects Futures
The traumatic brain injury data presented here reveals both the devastating scope of brain injuries in America and the critical importance of awareness, prevention, and appropriate response. Every family should understand these statistics not to create fear, but to promote preparation, prevention, and proper action when brain injuries occur.
If you or a loved one has sustained a brain injury due to someone else’s negligence, early legal consultation can help ensure access to the resources needed for optimal recovery. The statistics show that brain injuries can have lifelong consequences – making proper medical care, rehabilitation, and legal advocacy essential for protecting your family’s future.
The brain injury statistics and TBI facts presented in this article are based on the most recent data available from the Centers for Disease Control and Prevention, National Center for Injury Prevention and Control, and peer-reviewed medical research as of January 2025. If you believe you or a loved one may have sustained a traumatic brain injury, seek immediate medical attention. This information is provided for educational purposes and does not constitute medical or legal advice.
Sources and Citations:
- Centers for Disease Control and Prevention. TBI Data | Traumatic Brain Injury & Concussion
- Centers for Disease Control and Prevention. Facts About TBI | Traumatic Brain Injury & Concussion
- Centers for Disease Control and Prevention. About Moderate and Severe TBI
- Centers for Disease Control and Prevention. Health Disparities in TBI
- The Scope and Burden of Traumatic Brain Injury – NCBI Bookshelf
- Ma VY, et al. Costs of nonfatal traumatic brain injury in the United States, 2016 – PubMed
- Centers for Disease Control and Prevention. Economics of Injury and Violence Prevention
- USAFacts. How common are traumatic brain injuries in the US?
- Medscape. Millions in Lost Wages for Traumatic Brain Injury Survivors
Michael J. Rodriguez, Esq. is a board-certified brain injury attorney practicing exclusively in traumatic brain injury litigation throughout New Jersey. With 15+ years of experience, he has secured record-breaking settlements for TBI victims. Graduate of Rutgers Law School (J.D. 2008, LL.M. 2009) and member of the New Jersey Association for Justice and Brain Injury Association of New Jersey.